UK Video Games Market
Contents
About This Page
All facts and stats on this page are currently sorted in order of publication. Therefore some stats released earlier, such as industry value measurements may have been superceded by later data.
2021 Stats
- According to Ukie's annual UK Consumer Games Market Valuation, UK consumer spent a record £7bn on game and game related activities in 2020, an increase of +29% on the previous year
- Game software grew +18.5% to a record £4.55bn
- Game hardware saw an explosive year, jumping +60.8% to £2.26bn
- Spending on game culture products and activities grew to £199m, despite many areas experiencing significant difficulties due to the pandemic.
- A full breakdown of consumer games spend can be found at the UK Consumer Games Market Valuation page.
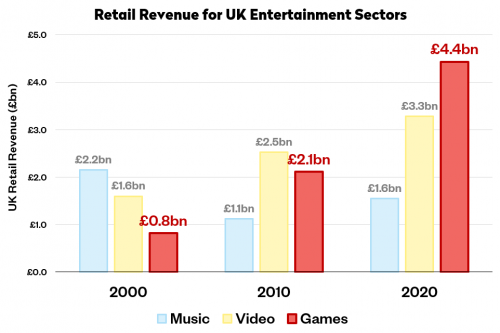
- In 2020, the retail value of games software was four-and-a-half times larger than it was in 2000, growing from £815m to £4.43bn over the ten-year period. (ERA, May 2021)
- Game software now represents 47.8% of the combined music, video and games sectors, making it almost as big as both other sectors put together.
- For 2020 revenues, Newzoo ranked the UK the 6th largest market globally, worth $5.5bn. This follows China at No.1, America, Japan, South Korea and Germany. (Newzoo, Jan 2021)
2020 Stats
- In 2019, UK consumers spent £5.35bn on video games and game-related products, a -4.8% decline on 2018's record-breaking year. Full details are available in Ukie's 2019 UK Consumer Games Market Valuation.
- Game software saw a pause in the growth trend of the recent years, with revenues plateauing and a small -2.1% drop to £3.85bn.
- Hardware saw a slower year, with a -14% decline to £1.35bn, mirroring demand for last-gen consoles.
- Broader interest in games continues to grow with UK audiences, with game culture revenues climbing +28.5% to £146m.
- According to the Entertainment Retailers' Association, the UK games software market was worth £3.77bn in 2019, accounting for 48% of the UK's £7.8bn entertainment media market. (ERA, Mar 2020)
- Digital revenue made up 84% of all games software revenues at £3.17bn, compared to physical sales at £606.2m. Physical sales was split between £274.2m in online purchasing versus £328.4 in the high street.
- At £3.17bn, digital game revenues were equal to the revenues of all digital video revenues (£2.1bn) such as Netflix and digital music revenues (£1.1bn) such as Spotify combined, despite the impacts of the end of the current console cycle.
| Revenue Type | Games | Video | Music | Total |
|---|---|---|---|---|
| Digital | £3,171.5 | £2,109.4 | £1,092.6 | £6,373.5 |
| Online physical | £274.2 | £211.6 | £137.4 | £623.2 |
| Bricks & mortar physical | £328.4 | £289.0 | £180.7 | £798.1 |
| Total | £3,774.1 | £2,610.0 | £1,410.7 | £7,794.8 |
Source: ERA, Mar 2020
- In 2019, there were 5,544 physical outlets selling video games in the UK, compared to 10,001 outlets for video and 8,450 for music. (ERA, Mar 2020)

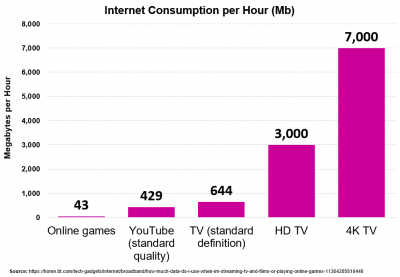
UK Internet Consumption per Hour for major media types (2020). Source
- On average, playing online games consumes around 43MB of internet data per hour, compared to 429MB for Youtube (standard definition), 644MB for TV (standard definition), 3,000MB for HD TV and 7,000MB per hour for 4K TV. (BT, Mar 2020)
2019 Stats
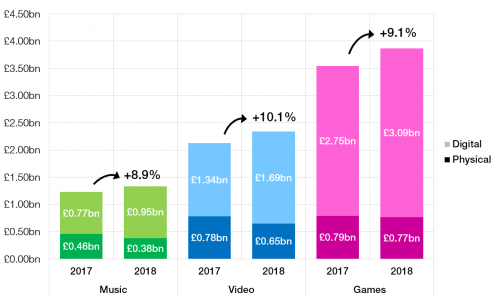
- Landmark figures released by the Entertainment Retailer's Association show that in 2018 UK sales of games have now eclipsed that of both music and video combined, reaching a record £3.86bn across both physical and digital, an increase of +9.1% on 2017. Game sales now represent 51.3% of the overall £7.54bn entertainment retail market. (ERA, Jan 2019)
- Digital games sales were the key driver of growth, increasing +12.5% to £3.09bn, or 80.1% of overall game revenue. Physical sales saw a small decline of -2.8% to £769.9m. Overall, the UK games market has now more than doubled since 2007.
- 22 million boxed games were sold in 2018, a drop of 7.1 per cent on 2017, despite physical revenues dropping only -2.8% . Nintendo Switch game sales, usually retailing at higher prices, were a major factor in bouying revenues, with Switch game unit sales increasing +90.1% and revenues +73.4% from 2017. (Gamesindustry.biz / Ukie/ GfK, Jan 2019)
2018 Stats
- The UK’s entertainment and media sector is predicted to grow by £8bn over the next four years to a total of £76bn, making the UK the second largest market in Europe, the Middle East and Africa (EMEA). (PwC, Jun 2018)
- By 2020, total UK video games revenue (£5.5bn) is expected to overtake total spend on books (£4.9bn). (PwC / digitsaltveurope.com, Jun 2018)
- UK Digital game purchases are forecast to reach £721m within the next four years and overtake physical game spend for the first time. (PwC, Jun 2018)
- The UK’s fastest growing entertainment and media sector is Virtual Reality, growing at 34 per cent annually to reach £1.2bn in revenue by 2022. VR headsets are forecast to sell with more than 7.8m cumulatively by the same period. (PwC, Jun 2018)
- The UK’s VR industry will generate more revenue than any other country in Western Europe over this time. (PwC / digitsaltveurope.com, Jun 2018)
- The UK’s second fastest growing entertainment and media sector is esports, growing 21% year on year to reach £48m in revenue by 2022. (PwC / digitsaltveurope.com, Jun 2018)
- Data consumption in the UK will grow by 22% year-on-year till 2022, overtaking France in 2021 to become the biggest market in Western Europe. (PwC, Jun 2018)
- Combined UK physical and digital sales reached a record £3.35bn in 2017, increasing 9.6% from 2016. The value of the UK games home sales market almost equals that of music and video combined, comprising 46.3% of the overall value of the sector. (ERA, Jan 2017)
- Digital games sales grew 12.1% in the UK to £2.56bn in 2017, while physical game sales reversed recent trends, increasing 2.1% to £792m. (ERA, Jan 2017)
- The UK is ranked as the 6th largest games market globally ($4.453m), after China, USA, Japan, South Korea and Germany (Newzoo, Jun 2018)
- 37.3m people in the UK play video games. (Newzoo, Jun 2018)
2017 Stats
- The UK consumer market for games was valued at a record £4.33bn in 2016, up 1.2% from 2015 (£4.28bn). (Ukie, Feb 2017)
- 2016 was the biggest ever year for games software, exceeding £3bn in sales for the first time, driven by record results in both Digital and Online sales (£1.22bn, +11.1%) and Mobile Games, which achieved revenues just short of £1bn (£995.1, +16.9%). Boxed software remains a substantial factor in software sales, despite the general trend towards digital, achieving £766.7m in sales in 2016 (-15.2%). (Ukie, Feb 2017)
- The impact of VR and esports drove a huge increase in PC Game Hardware (£258m, +64.3%), with UK VR Hardware (headset) sales tracked for the first time, valued at £61.3m in 2016. (Ukie, Feb 2017)
- The games industry's impact on broader sectors also showed a record year, with increased sales across game-related toys, merchandise, books, movies and soundtracks, as well as game-based events around the UK, contributing to a record £100.5m in revenues across these segments. (Ukie, Feb 2017)
- The UK is the 5th largest video game market in 2017 in terms of consumer revenues, after China, USA, Japan, South Korea and Germany. (Newzoo, June 2017)
- The UK games market will be Europe’s largest market and the fifth largest globally behind the US, China, Japan and South Korea, growing at 6.7% CAGR and worth £5.2bn in 2021. (PWC, June 2017)
- By December 2017, 70.6m PS4 consoles and 617.8m PS4 games have been sold to date. (SIEE, Dec 2017)
- As of November 2017, the number of PS4 and Xbox One consoles now sold in the UK (the ‘installed base’) stands at 7.5 million, 14% ahead of the installed base at the same point in the previous console generation. (GAME / GfK, Nov 2017)
- Since launch on 3rd March 2017, over 469,000 Nintendo Switches have been sold in the UK & Spain, despite a limited supply. (GAME / GfK, Nov 2017)
- The UK will have the largest and fastest growing VR hardware market in EMEA, worth £0.8m in 2021, growing at 76% CAGR. (PWC, June 2017)
- Console gaming leads the market at $2bn (52%), nearly double mobile’s $1.1bn (28%). PC gaming makes up the remaining 20% at $800m. (Newzoo, Aug 2016)
- The UK is estimated to be the sixth largest video game market in 2015 in terms of consumer revenues, after the China, the US, Japan, South Korean and Germany. The UK market is estimated to be worth $3.5bn. This figure excludes hardware sales and tax (Newzoo, Aug 2016)
- In 2016, games sales in the UK generated more revenue than either video or music, increasing by +2.9% to £2.96bn. This record figure makes the games market 1.3 times the size of the video market (£2.25bn) and 2.6 times the size of music (£1.1bn). (ERA, Jan 2017)
- While physical sales of games declined -16.4% from £927m to £776 in 2016, digital sales increased +12.1% to £2.18bn, more than making up the difference. Physical sales were also down in both video and music, with video seeing a greater decline of -17.1% and music down -7.3%. (ERA, Jan 2017)
- ERA also found that the 2016 digital sales of games (£2.2bn) was larger than the combined digital sales of video and music (£1.9bn). (ERA, Jan 2017)
- Electronic Art's FIFA 17 was the highest selling entertainment product in 2016, selling 2.5m units, approximately 9% more sales than Star Wars: The Force Awakens, which sold 2.3m units. (ERA, Jan 2017)
- Pokémon GO was the most frequently-used gaming app in the UK and was opened an average of 4.82 times per day by its users, in the period 27 Sept - 23rd Dec 2016. (Ofcom, Aug 2017)
- The UK is the 4th largest market for iOS apps & games, both in terms of downloads and revenues. It also places 6th for Google Play revenues. (App Annie, Jan 2017)
2016 Stats
- The UK games market grew by 5% to £4.19bn in 2015, up from £3.94bn in 2014. Growth has slowed slightly from 2013-2014, when it was up 13% from £3.48bn (MCV and Ukie, Feb 2016, LINKS for 2015, 2014)
- Games sold more than video or music in 2015. The games market grew by +10% to reach £2.8bn, while video grew by +1.5% to reach £2.2bn and music by +3.5% to reach £1bn. (ERA, Jan 2016)
- While physical boxed software sales decreased by -2.2% (to reach £928m), the digital sales grew by +17.1% (to reach £1,899m). (ERA, Jan 2016, LINK)
- Games represented 46% of the combined games, video and music entertainment market in 2015. (ERA, Jan 2016, LINK)
- The UK games market was worth nearly £4.2bn in consumer spend in 2015, up 7.4% from £3.94bn in 2014 (Ukie, March 2016)
- The industry’s biggest consumer market revenue streams in 2015 were Digital Console and PC (£1,224m, +13.2%), Boxed Software (£904m, -3%), Consoles hardware (£689m, -28% after the initial sales peak for next-gen consoles) and Mobile gaming (£664m, +21.2%). (Ukie, March 2016)
- The digital sales of games (£1.9bn) are bigger than the combined digital sales of video and music (£1.3bn). (ERA, Jan 2016)
- 47% of UK smartphone owners use apps on their phones to play games – more that use apps for online banking (40%) or reading the news (33%). (Deloitte, Oct 2016)
2015 Stats
- In the 6 months prior to 10th April 2016, people who bought Toys to Life spent an average of £59.77 on figures. 61% of people who bought a starter pack in the last 6 months also bought at least one additional figure. TTL shoppers also spent £36.99 on average on other new boxed games. (Kantar, May 2015)
- UK is the Nbr1 territory for pre-orders across EU (23% of UK players stated they pre-ordered a title in the last year). (MCV and Ipsos MediaCT, Apr 2015)
- The Entertainment Retailers Association found that games sold more than video or music in 2014. The games market grew by +7.5% to reach £2.5bn, while video decreased by -1.4% to reach £2.2bn and music by -1.6% to reach £1bn. (ERA, Jan 2015)
- ERA also found the digital sales of games (£1.5bn) to be bigger than the combined digital sales of video and music (£1.3bn). (ERA, Jan 2015)
- The PC digital market in 2014 was worth £741m (this includes DLC, MMO and social games revenue), the console digital market £118m and mobile £548m. (Superdata, MCV Issue 829, Apr 2015)
- Digital segments’ audience that grew most over the past 4 years (until 2014) have been the social segment (from 13m monthly active users to 31m users, and free-to-play MMO going from 8m to 13m users). (Superdata, MCV Issue 829, Apr 2015)
- 81% of Total War: Attila units sold in its 1st week were digital copies. ([1] MCV, Mar 2015)
- Digital and online game sales were up from £891m to £1,048m in 2014, an 18% increase. (MCV and Ukie, Feb 2015)
- Digital points cards were worth £158m in 2014, of which £26m were generated by points cards for specific individual titles. (MCV and Ukie, Feb 2015)
- The UK is the EU country with the highest mobile games jobs in the EU-28, with 5,000 full-time employees. (Deloitte and ISFE Mobile Games in Europe September 2015)
- Household device ownership in Q1 2015: 44% households own an iPhone, 46% an Android phone and 12% a Windows phone (GameTrack (ISFE/Ipsos MediaCT) – Quarter 1 2015)
- 30% of the total UK game revenue is generated via apps games in Q3 2015. (GameTrack (ISFE/Ipsos MediaCT) – Quarter 3 2015)
- 10.2m (21%) of 6-64 year old play on smartphones and 8.4m (18%) on tablets in Q3 2015. (GameTrack (ISFE/Ipsos MediaCT) – Quarter 3 2015)
2014 Stats
- In the UK in 2014, 41% of players pay when playing mobile games. 5% of these payers are big spenders, lower than the 6% average for the 10 countries displayed in the report. It’s apparently opinion that gets people playing a game: 36% of UK players start a game because a friend or relative recommended it, and 35% because it had good reviews. Interestingly the UK is the country amongst the 4 measured on this where audience rely the most on good reviews to play. (Newzoo Dec 2014)
- Looking at smartphones sales in the UK, for August-October 2014, the sales share was 52.3% for Android, 39.5% for iOS (iPhone 6 launch boosted sales), 7.7% for Windows phone and 0.3% for BlackBerry and Others. (Kantar Worldpanel, Dec 2014)
Pre-2014 Stats
We presently hold relatively little information on the UK market pre-2014. Below are some selected reports containing insights on this period.


