Difference between revisions of "Global Video Games Market"
(→2017 Stats) |
(→2017 Stats) |
||
| Line 119: | Line 119: | ||
*The Asia-Pacific market will generate 47% ($51.2bn) of global revenues in 2017, with China accounting for $27.5bn of the total. In comparison, the US will account for $25.1bn and the EMEA will be make up $26.2bn. ([https://newzoo.com/insights/articles/the-global-games-market-will-reach-108-9-billion-in-2017-with-mobile-taking-42/ Newzoo], Apr 2017) | *The Asia-Pacific market will generate 47% ($51.2bn) of global revenues in 2017, with China accounting for $27.5bn of the total. In comparison, the US will account for $25.1bn and the EMEA will be make up $26.2bn. ([https://newzoo.com/insights/articles/the-global-games-market-will-reach-108-9-billion-in-2017-with-mobile-taking-42/ Newzoo], Apr 2017) | ||
| − | |||
*In January 6th 2017, Valve’s digital PC games platform Steam reached 18.5m concurrent users. ([https://www.gamasutra.com/view/news/312771/Steam_sets_new_concurrent_user_record_at_185M.php Gamasutra], Jan 2017) | *In January 6th 2017, Valve’s digital PC games platform Steam reached 18.5m concurrent users. ([https://www.gamasutra.com/view/news/312771/Steam_sets_new_concurrent_user_record_at_185M.php Gamasutra], Jan 2017) | ||
Revision as of 10:15, 26 April 2019
Contents
About This Page
All facts and stats on this page are currently sorted in order of publication. Therefore some stats released earlier, such as industry value measurements may have been superceded by later data.
Other Global Industry Categories
The data company Newzoo also collates and updates a number of useful infographics of global industry headlines and individual country metrics.
2019 Stats
- Games and interactive media industry grew to $119.6bn in 2018, up 13% on the previous year. (Superdata, Jan 2019)
- Mobile games made up the largest share of global revenues at $61.3bn, followed by PC at $35.7bn and console at $12.7bn.
- The rest of the total was made up of $6.6bn from XR (VR/AR) revenues and $5.2bn on game video content (Youtube/Twitch etc).
- Free-to-play titles earned $87.7bn in 2018, representing 80% of digital games revenue with 62% of free-to-play revenues coming from Asian mobile games,(Superdata, Jan 2019)
- Free-to-play titles earned $54.3billion in Asia, $14.8billion in North America, and $11billion in Europe in 2018. (Superdata, Jan 2019)
- Fortnite was the top free-to-play game by revenue in 2018, earning $2.4bn - nearly two times the amount generated by Dungeon Fighter Online, ranked second. Other titles in the F2P top ten include Candy Crush Saga at $1.1bn, Pokemon GO at $1.3bn and League of Legends at $1.4bn. (Superdata, Jan 2019)
- The rise of Fortnite greatly increased the visibility of free-to-play console games, causing their overall revenue to explode by +458% year on year. (Superdata, Jan 2019)
- Premium game revenues rose 10% to $17.8bn in 2018, with North America ($7.2bn) and Europe ($7.0bn) generated 80% of premium games revenue.
- PlayUnknown’s Battleground’s was the top premium PC and console game by revenue in 2018, earning $1.028million. This was followed by FIFA 18, which generated $790million and Grand Theft Auto V which five years after its release still earned $628million. (Superdata, Jan 2019)
- In 2018, Netflix-like game subscriptions rose to prominence. The top three game subscription offerings - Xbox Game Pass, Playstation Now and the EA Origin Access - earned $273m worldwide in Q3 2018. (Superdata, Jan 2019)
- Games industry software/hardware combined revenue is predicted to drive well over $200 billion revenue by 2023. (Digi-Capital, Mar 2019)
- Investment in games companies reached a record $5.7 billion in 2018. (Digi-Capital / Venturebeat, Mar 2019)
- Epic Games’ $1.25 billion raise was the biggest round for a game company in 2018, and it was also the largest non-IPO games investment of all time.

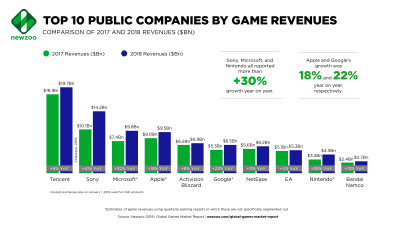
Newzoo Top-10 Public Game Companies by Revenues (2018)
- In 2018, the top 25 public companies by game revenues generated a combined $107.3 billion, up +16% from 2017. Together, these companies accounted for almost 80% of the $134.9 billion global games market. (Newzoo, Apr 2019)
- Combined, the top 10 companies' revenue grew +19% year on year.
- Console revenues showed particularly strong growth in 2018, accounting for 38% of revenues earned by the top 25 companies, up from 34% in 2017. Notably, five out of the top 10 companies earned most of their revenues from console gaming.
- Tencent was the world’s #1 public company by game revenues for the sixth year running, earning $19.7 billion in revenues and accounting for almost 15% of the entire games market.
- Sony (#2) generated revenues of $14.2 billion, a year-on-year growth of +41% — the highest in the top 10.
- Microsoft generated revenues of $9.8 billion in 2018, growing +32% from 2017, overtaking Apple as the third-largest company by game revenues.
- Nintendo (#9) also had a strong year, with revenues reaching $4.3 billion, up +36% from 2017, driven by the popularity of the Nintendo Switch.
- Activision Blizzard (#5) earned revenues of $6.9 billion, growing +6% over last year, making it the fifth largest company.
- Electronic Arts (#8) generated revenues of $5.3 billion in 2018 with year-on-year growth of +4%.
- Ubisoft (#13) produced $2.2 billion in revenues, growing +3% year on year.
- In the fiscal year to 31st March 2019, 118.55m units of software were sold for the Nintendo Switch, an 86.7% increase on the previous year (gamesindustry.biz, Apr 2019)
- 23 games sold more than on million units, including Mario Kart 8 Deluxe which sold 7.47m units worldwide.
- Full-game downloads on the Nintendo store almost doubled year-on-year to reach ¥118.8 billion ($1.1 billion).
- In the same period, 16.95 million units of the Switch were sold, an increase of 12.7% year-on-year, to a total since launch of 34.74m.
- Nintendo earned ¥1.2 trillion ($10.7 billion) in revenue in the fiscal year, a 13.7% increase on the previous year. It earned ¥194 billion ($1.7 billion) in profit, up 39% year-on-year.
- F2p titles amassed 80% of digital games revenue in 2018 but premium games still performed well in Western markets – RDR2 earned $516m in Q4, helping grow premium games revenue 10% year on year (Superdata, Jan 2019)
- Cloud-based game content and cloud-based games PC services markets were worth a combined $476 million in 2018. This is forecast to grow to $2.7 billion in 2023. (IHS Markit, Apr 2019)
2018 Stats
- The global market for video games will reach $137.9bn in 2018, an increase of 13.3% on 2017. It is estimated to reach $180.1bn by 2021. (Newzoo, Jun 2018)
- There are more than 2.3 billion active game players in the world this year, of which 46%, or 1.1 billion, spend money on games. (Newzoo, Jun 2018)
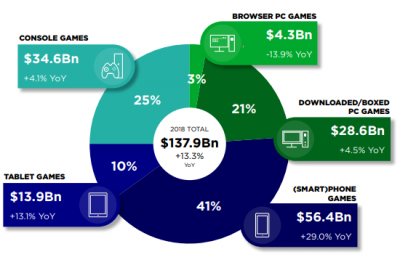
- Console games will generate $34.6billion and capture 25% of the market by the end of 2018. (Newzoo, Jun 2018)
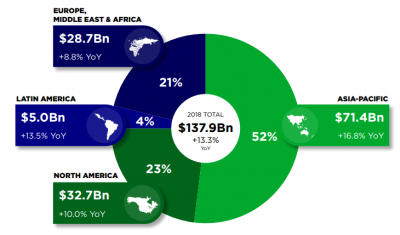
- The Asia-Pacific region leads the global market and the is fastest growing, increasing16.8% year-on-year to $71.4bn, or 52% of the total global market. North America represents 23% of the global market, up 10% to $32.7bn. EMEA is 21% of the market, up 8.8% to $28.7bn and Latin America makes up the remaining 4%, up 13.5% to $5bn. (Newzoo, Jun 2018)
- Mobile revenues will be the largest segment of the global games market, representing over half of total global revenues for the first time, generating $70.3bn overall from $56.4bn of smartphone and $13.9bn of tablet revenues. Smartphone games are also the fastest growing segment, increasing 29% year-on-year. (Newzoo, Jun 2018)
- All segments of the games market are growing steadily. Console revenues will increase 4.1% to $34.6bn in 2018 and $39bn by 2021. PC games will reach $32.9bn in 2018, representing 24% of the global market. (Newzoo, Jun 2018)
- The interactive entertainment sector generated a record $108.4bn in 2017, with the three major games revenues split between mobile ($59.2bn), PC ($33bn) and console ($8.3bn). Wider interactive sector made up the rest of the revenues, XR (Extended / Mixed Reality - £4bn), game video content ($3.2bn) and esports ($0.8bn). (Superdata, Jan 2018)
- 2017’s $8.3bn global console game market was dominated by North American and Euopean markets, at $4.2bn and $3.1bn respectively. The Asian console market reached $0.2bn. (Superdata, Jan 2018)
- Consumers spent $14B more on mobile games in 2017 than in 2016. Games such as Arena of Valor and Fantasy Westward Journey from Asian publishers like Tencent and NetEase contributed to a 31% year-over-year growth for the worldwide mobile market. (Superdata, Jan 2018)
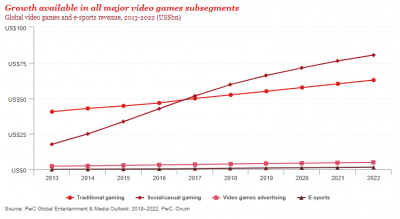
- The global video games market is set to grow considerably in the period to 2022. The largest segment will be social / casual games, generating over $80bn by 2022. (PwC, Jun 2018)
- Red Dead Redemption 2 generated $725 million in its first three days. It’s the second biggest opening for a product in entertainment history. (Gamesindustry.biz, 2018)
- According to Activision Blizzard, the Call of Duty franchise has generated more revenue than the Marvel Cinematic Universe in the box office, and double that of the cumulative box office of Star Wars. (MCV, Nov 2018)
- Global PC game revenue reached $33bn in 2017, of which free-to-play games contributed $15bn. (Superdata, Jan 2018)
- The top grossing free-to-play PC games in 2017 were League of Legends ($2.1bn), Dungeon Fighter Online ($1.6bn) and CrossFire ($1.4bn). (Superdata, Jan 2018)
- In 2017, 56% of the PC game market was comprised of RPGs (34%) and Shooters (22%). (Superdata, Jan 2018)
- Bluehole’s PlayerUnknown’s Battlegrounds was the largest grossing PC paid/premium game revenue, generating $714m or 12% of the sub-sector’s revenues. (Superdata, Jan 2018)
- According to Steamspy, 7,672 games were released on Valve’s Steam platform in 2017, an increase of 53% on 2016’s 5,006 games. (Steamspy / gamesindustry.biz, Jan 2018)
2017 Stats
- Approximately 2.2bn people play games worldwide (Newzoo, Apr 2017), although some estimates put this as high as 2.6bn. (Unity, Apr 2017)
- The global games market will be worth $116bn in 2017, growing by 10.7% on the previous year. With a projected CAGR of 8.2% over the coming years, it is expected to reach $143.5bn by 2020. (Newzoo, Nov 2017)
- The global mobile revenues will remain just short of half of the market (43%), worth $50.4bn in 2017. Current estimates see this growing to $72.3bn by 2020. (Newzoo, Nov 2017)
- The console market represents 29% of the current market, worth $33.3bn and the PC market a similar share at $32.3bn. (Newzoo, Nov 2017)
- Sony's PlayStation 4 console has shipped 82.2m units globally since launch in November 2013 and is projected to reach 90m units by March 2019. (gamasutra, Aug 2018)
- Sony’s PlayStation 4 console has sold 67.5m units to date and is projected to sell 79m by the end of March 2018. (GamesIndustry.biz, Oct 2017)
- The global games market is now worth over $100bn annually, reaching a total of $101.1bn in 2016. With a projected CAGR of 6.2%, it is expected to reach $108.9bn by the end of 2017 and $128.5bn by the end of 2020. (Newzoo, Apr 2017)
- 2017 is expected to be the year mobile revenues become the largest segment of the global market, growing by 19.3% YOY to reach $46.1bn or 32% of the global total. Digital game revenues will account for $94.4bn or 87% of the global market. (Newzoo, Apr 2017)
- The Asia-Pacific market will generate 47% ($51.2bn) of global revenues in 2017, with China accounting for $27.5bn of the total. In comparison, the US will account for $25.1bn and the EMEA will be make up $26.2bn. (Newzoo, Apr 2017)
- In January 6th 2017, Valve’s digital PC games platform Steam reached 18.5m concurrent users. (Gamasutra, Jan 2017)
- Valve’s Steam platform now counts 67 million monthly active players and 33 million daily active players, as of August 2017. At peak, this relates to 14 million concurrent users per day, up from 8.4 million in 2015. (Geekwire, Aug 2017)
- Of Steam sales in January-August 2017, 34% of sales were to North America, 29% Western Europe and 17% Asia, with the remaining split between other regions. (Geekwire, Aug 2017)
- Microsoft’s Xbox Live platform counts 53 million monthly active users, as of Q4 2016/17. They also a quarterly “gaming” revenue of $1.657bn for the same period. (Microsoft, Aug 2017)
- Valve’s Steam platform reported 125m total active lifetime users in 2015, estimated up to 150m by August 2017. (PC Games Insider, Aug 2017)
- For the first time, Ubisoft has reported that recurring player investment (e.g. the sale of in-game items, DLC, season passes and subscriptions) has outperformed digital full-game sales in Q1/2 2017. (Ubisoft, Oct 2017)
2016 Stats
- The top 25 public companies by game revenues generated $41.4 billion in the first half of 2017, increasing 20% compared to the same period in 2016. (Newzoo, Sept 2016)
- Mobile gaming accounted for 42% of all revenues generated by the top 10 companies ($31.4bn), up from 40% in the first half of last year. Tencent was once again the largest gaming company in the world with revenues of $7.4 billion. Sony grew by 25% year over year to take the #2 spot with revenues of $4.3 billion. (Newzoo, Sept 2016)
- The global video games market generated $91bn in 2016, with mobile sector making up the largest share ($40.6bn). PC accounted for $35.8bn and Console $6.6bn. Esports ($0.9bn), gaming videos ($4.4bn) and VR ($2.7bn) made up the remainder. (SuperData, Dec 2016)
- The top 25 Public Companies by Game Revenues generated $34.5 billion in the first half of 2016, an increase of 22% compared to the same period in 2015. (Newzoo, Oct 2016)
- According to Newzoo’s estimation, China has overtaken the US as the as world’s largest gaming market at $24.4bn, vs the US’s $23.6bn. With a larger population and gaming yet to reach a mature penetration, we can expect China’s lead to grow over time. (Newzoo, June 2016)
- China is now the largest national market for iOS App Store revenues overall, earning more than $1.7 billion in the Q3 2016, exceeding the US by around 15%. Games make up approximately 75% of that revenue, in which China has been leading since Q2 2016. (App Annie, October 2016, LINK)
- China is the no.1 national market for iOS App Store Games revenues, exceeding the US and Japan revenues in Q2 2016. (App Annie, Oct 2016)
- As of December 2016, the Sony PlayStation 4 has sold through over 50 million units worldwide. (including sales of the PlayStation 4 Pro) (GI.biz, Dec 2016)
- The Asia-Pacific region dominates the global revenues with 47% share ($46.6bn), North America and the EMEA make up approximately a quarter each (25%, $25.4bn and 24%, $23.5bn). Latin America is the smallest region, but also the fastest growing, up 20.1% yoy to $4.1bn (4%). (Newzoo, June 2016)
- Of all console gamers, 87% also plays games on a PC. (Newzoo, June 2016)
- As of Q3 2016, GTA V has sold-in (shipped to retailers) 70 million copies since launch. (GameSpot, Nov 2016)
2014 Stats
- When looking at the Top 20 Entertainment Products of 2013 in the UK, Grand Theft Auto V was the leader with 3.67m units sold, ahead of Skyfall (2.96m units on DVD and Blu-ray). The third product in units sold was FIFA 14 (2.66m units sold) ahead of The Hobbit DVD and Blu-ray (2.07m units) (MCV, Jan 2014)
2013 Stats
- GTA V made $1bn worldwide in 3 days in 2013, faster than any other entertainment product including movies. (MCV, Sept 2013)


