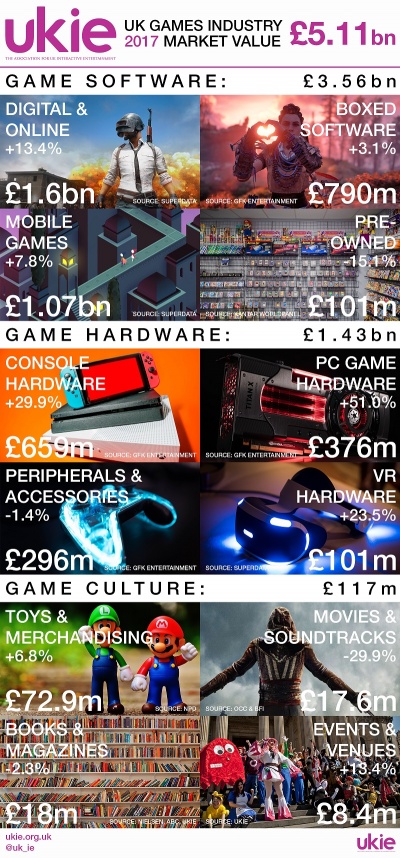
2018 UK Consumer Games Market Valuation
Revision as of 14:05, 26 March 2019 by UkieLuke (talk | contribs) (Created page with "thumb|border|400px|Ukie 2017 UK Consumer Games Market Valuation All figures shown below are those given on the date of publication....")
All figures shown below are those given on the date of publication. Later valuations may have revised the figures for this year.
Contents
2018 Valuation
Game Software
Game Hardware
Game Culture
Valuation Summary
The 2018 UK games market consumer spend valuation details in full are as follows:
| Categories | Data Supplier | 2016 (£m) | 2017 (£m) | % Growth |
| Digital & Online | IHS Markit | 1,669.0 | 2,008.0 | +20.3% |
| Boxed Software | GfK Entertainment | 790.5 | 770.0 | -2.6% |
| Mobile Games | IHS Markit | 1,079.0 | 1,167.0 | +8.2% |
| Pre-owned | Kantar Worldpanel | 98.2 | 67.9 | -30.8% |
| Game Software Total | 3,636.7 | 4,012.9 | +10.3% | |
| Console Hardware | GfK Entertainment | 659.3 | 702.0 | +6.5% |
| PC Game Hardware | GfK Entertainment | 376.0 | 445.0 | +18.4% |
| Perhiperals & Accessories | GfK Entertainment | 296.1 | 355.0 | +19.9% |
| VR Hardware | IHS Markit | 91.0 | 72.0 | -20.9% |
| Game Hardware Total | 1,442.3 | 1,574.0 | +10.7 | |
| Toys & Merchandise | NPD | 77.7 | 59.3 | -23.7% |
| Books & Magazines | Nielsen Bookscan / ABC / Ukie | 18.0 | 17.8 | -1.3% |
| Movies & Soundtracks | Official Charts Company / BFI | 17.6 | 23.6 | +34.0% |
| Events & Venues | Ukie | 8.5 | 8.9 | +5.5% |
| Game Culture Total | 121.8 | 109.6 | -10.0% | |
| UK Games Market Total | 5,180.8 | 5,696.5 | +10.0% |
