Difference between revisions of "2016 UK Consumer Games Market Valuation"
(Updated image link to new image) |
(Updated consumer valuation graphic) |
||
| Line 1: | Line 1: | ||
| − | [[File:Industry-Valuation-2016. | + | [[File:Ukie-Industry-Valuation-2016.png|thumb|border|400px|Ukie 2016 UK Consumer Games Market Valuation]] |
All figures shown below are those given on the date of publication. Later valuations may have revised the figures for this year. | All figures shown below are those given on the date of publication. Later valuations may have revised the figures for this year. | ||
Latest revision as of 15:07, 24 January 2019
All figures shown below are those given on the date of publication. Later valuations may have revised the figures for this year.
Contents
2016 Valuation
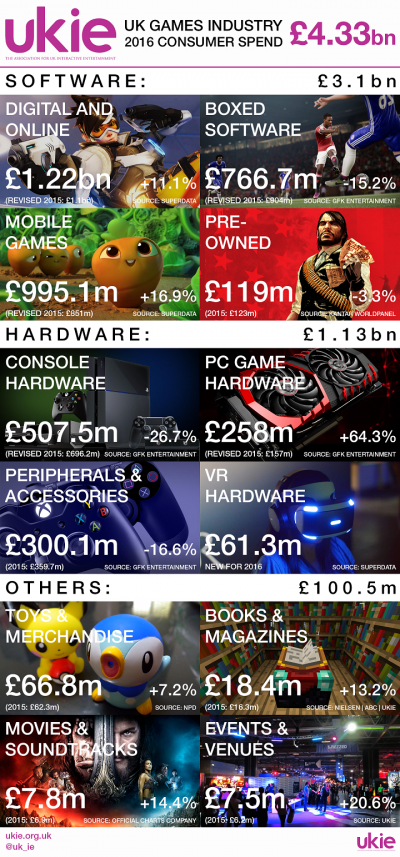
The UK games market was valued at a record £4.33bn in 2016, up +1.2% from the 2015 figures.
Game Software
The result shows positive growth for the games and interactive entertainment economy, including an +11.1% increase in digital console and PC games sales to £1.22bn and an impressive +16.9% rise in UK mobile games revenue - now worth £995m.
Physical boxed software sales declined -15.2% to £766.7m, although this drop was more than made up by gains in the digital and mobile sectors. Pre-owned software saw a slight drop of -3.3% to £119m, with a lower average selling price masking an increase of sales. Overall, software sales in the UK exceeded £3bn for the first time.
Game Hardware
The consumer release of the first VR headsets has helped fuel the growth of the sector though the sales of VR hardware, valued at £61.3m and included in the market valuation for the first time. The impact of VR was also seen in the sale of top-end graphics cards, driving a huge +64% increase in PC game hardware to £258m.
As the current generation of the console cycle matures, there was an expected reduction in sales of new console hardware, down -26.7% to £507m. Console perhiperals and accessories was similarly affected, dropping -16.6% to £300.1m.
Game Culture
UK games events have also seen a strong increase, up 20.6% from 2015, fuelled by a growing esports scene in the UK and consumers engaging more with the industry at UK-wide games shows such as popular Insomnia and upcoming EGX Rezzed.
The successes of both Pokémon GO and Minecraft were factors in increases for both categories for game-related toys and merchandise, and books and magazines. Toys and merchandise sales increased by +7.2% to £66.7m, with books and magazines increasing +13% to £18.4m.
Games' influence on the other creative sectors continues to grow, with games movies and soundtrack sales increasing +14.4% to £7.8m, helped along by the success of Duncan Jones' 'Warcraft: The Beginning'.
Valuation Summary
The 2016 UK games market consumer spend valuation details in full are as follows:
| Categories | Data Supplier | 2015 (£m) | 2016 (£m) | % Growth |
| Digital & Online | SuperData | 1,101.4 | 1,223.5 | +11.1% |
| Boxed Software | GfK Entertainment | 903.9 | 766.7 | -15.2% |
| Mobile Games | SuperData | 851.1 | 995.1 | +16.9% |
| Pre-owned | Kantar Worldpanel | 123.0 | 119.0 | -3.3% |
| Game Software Total | 2,979.4 | 3,104.3 | +4.2% | |
| Console Hardware | GfK Entertainment | 692.6 | 507.5 | -26.7% |
| PC Game Hardware | GfK Entertainment | 157.0 | 258.0 | +64.3% |
| Perhiperals & Accessories | GfK Entertainment | 359.8 | 300.2 | -16.6% |
| VR Hardware | SuperData | - | 61.3 | - |
| Game Hardware Total | 1,209.4 | 1,126.9 | -6.8% | |
| Toys & Merchandise | NPD | 62.3 | 66.8 | +7.2% |
| Books & Magazines | ABC | Ukie | 16.3 | 18.4 | +13.2% |
| Movies & Soundtracks | BFI | 6.9 | 7.8 | +14.4% |
| Events & Venues | Ukie | 6.2 | 7.5 | +20.6 |
| Game Culture Total | 91.7 | 100.6 | +9.7% | |
| UK Games Market Total | 4,280.4 | 4,331.8 | +1.2% |
