Difference between revisions of "2013 UK Consumer Games Market Valuation"
(Added data table & overview) |
(Updated consumer valuation graphic) |
||
| Line 1: | Line 1: | ||
| − | [[File: | + | [[File:Industry-Valuation-2013.jpg|thumb|border|400px|Ukie / MCV 2013 UK Consumer Games Market Valuation]] |
All figures shown below are those given on the date of publication. Later valuations may have revised the figures for this year. | All figures shown below are those given on the date of publication. Later valuations may have revised the figures for this year. | ||
Latest revision as of 15:10, 24 January 2019
All figures shown below are those given on the date of publication. Later valuations may have revised the figures for this year.
2013 Valuation
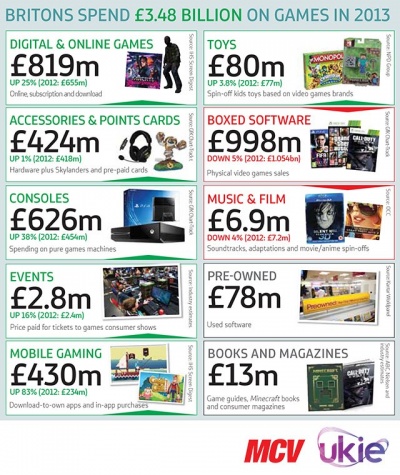
The UK market for games was valued at a record £3.48bn in 2013, representing +19.9% growth on the previous year.
Valuation Summary
The 2013 UK games market consumer spend valuation details in full are as follows:
| Categories | Data Supplier | 2012 (£m) | 2013 (£m) | % Growth |
| Digital & Online | IHS | 655 | 819 | +25% |
| Boxed Software | GfK Entertainment | 1,054 | 998 | -5% |
| Mobile Games | IHS | 234 | 430 | +83% |
| Pre-owned | Kantar Worldpanel | - | 78 | - |
| Game Software Total | 1,943 | 2,325 | +19.7% | |
| Console Hardware | GfK Entertainment | 454 | 626 | +38% |
| Accessories & Point Cards | GfK Entertainment | 418 | 424 | +1% |
| Game Hardware Total | 872 | 1,050 | +20.4% | |
| Toys & Merchandise | NPD | 77 | 80 | -3.8% |
| Books & Magazines | Nielsen and industry estimates | - | 13 | - |
| Movies & Soundtracks | Official Charts Company | 7.2 | 6.9 | -4% |
| Events & Venues | Industry estimates | 2.4 | 2.8 | +16% |
| Game Culture Total | 86.6 | 102.7 | +18.6% | |
| UK Games Market Total | 2,901.6 | 3,477.7 | +19.9% |
