Ukie 2019 UK Consumer Games Market Valuation
About Ukie's UK Consumer Market Valuation
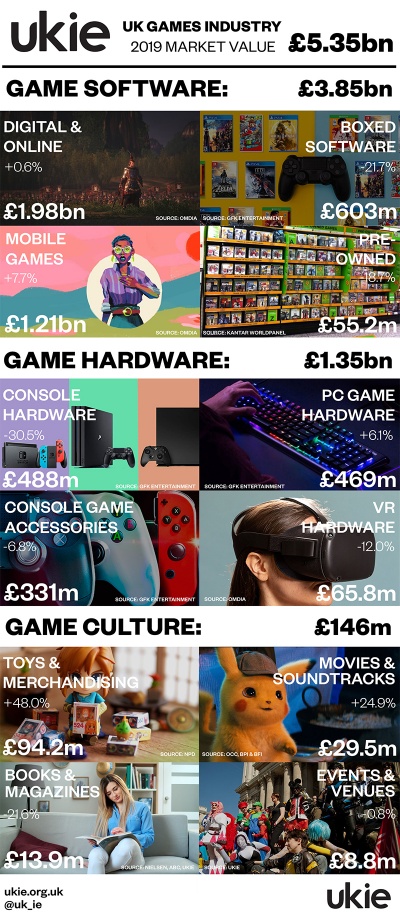
Every year, Ukie work with industry data partners to produce a valuation of UK consumer spend on games and game-related products.
Annual UK Consumer Market Valuations
Summary of Valuations to Date
Please note that each year, percentage growth is calculated from a revised estimation of the previous year to ensure consistency of measurement. Therefore growth amounts shown for each year may not directly correlate with the amounts shown in the official numbers for each year listed. Both reported and revised figures are provided for the most recent year in the tables below to demonstrate.
Annual Totals
| Year
|
Total Spend
|
% Growth
|
| 2019
|
£5.35bn
|
-4.8%
|
| 2018 (revised)
|
£5.6bn
|
|
| 2018
|
£5.7bn
|
+10.0%
|
| 2017
|
£5.11bn
|
+12.4%
|
| 2016
|
£4.33bn
|
+1.2%
|
| 2015
|
£4.19bn
|
+5.3%
|
| 2014
|
£3.94bn
|
+14.6%
|
| 2013
|
£3.48n
|
+19.9%
|
| 2012
|
£3.27bn
|
|
Game Software
| Year
|
Digital & Online
|
Boxed Games
|
Mobile Games
|
Pre-Owned
|
| Spend
|
% Growth
|
Spend
|
% Growth
|
Spend
|
% Growth
|
Spend
|
% Growth
|
| 2019
|
£1.98bn
|
+0.6%
|
£603m
|
-21.7%
|
£1.21bn
|
+7.7%
|
£55.2m
|
-18.7%
|
| 2018 (revised)
|
£1.96bn
|
|
£770.0m
|
|
£1.13bn
|
|
£68.0m
|
|
| 2018
|
£2.01bn
|
+20.3%
|
£770.0m
|
-2.6%
|
£1.17bn
|
+8.2%
|
£67.9m
|
-30.8%
|
| 2017
|
£1.6bn
|
+13.4%
|
£790.5m
|
+3.1%
|
£1.07bn
|
+7.8%
|
£101.1m
|
-15.1%
|
| 2016
|
£1.22bn
|
+11.1%
|
£766.7m
|
-15.2%
|
£955.1m
|
+16.9%
|
£119
|
-3.3%
|
| 2015
|
£1.224bn
|
+13.2%
|
£904m
|
-3.0%
|
£664m
|
+21.2%
|
£123m
|
+9.3%
|
| 2014
|
£1.048bn
|
+17.6%
|
£935m
|
-6.3%
|
£548m
|
+21.2%
|
£106.8m
|
+10.7%
|
| 2013
|
£819m
|
+25.0%
|
£998m
|
-5.0%
|
£430m
|
+83.0%
|
£78m
|
|
| 2012
|
£520
|
|
£1.42bn
|
|
£158m
|
|
|
|
Game Hardware
| Year
|
Console Hardware
|
PC Game Hardware
|
Peripherals & Accessories
|
VR Hardware
|
| Spend
|
% Growth
|
Spend
|
% Growth
|
Spend
|
% Growth
|
Spend
|
% Growth
|
| 2019
|
£488m
|
-30.5%
|
£469m
|
+6.1%
|
£331m
|
-6.8%
|
£65.8m
|
-12.0%
|
| 2018 (revised)
|
£702m
|
|
£442m
|
|
£355m
|
|
£74.8m
|
|
| 2018
|
£702.0m
|
+6.5%
|
£445.0m
|
+18.4%
|
£355.0m
|
+19.9%
|
£72.0m
|
-20.9%
|
| 2017
|
£659.3m
|
+29.9%
|
£376m
|
+51.0%
|
£296.1m
|
-1.4%
|
£100.8m
|
+23.5%
|
| 2016
|
£507.5m
|
-26.7%
|
£258m
|
+64.3%
|
£300.1m
|
-16.6%
|
£61.3m
|
|
| 2015
|
£689m
|
-24.7%
|
£138m
|
|
£360m
|
+24.6%
|
|
|
| 2014
|
£915m
|
+42.6%
|
|
|
£288m
|
+4.3%
|
|
|
| 2013
|
£626m
|
+38.0%
|
|
|
£424m
|
+1.0%
|
|
|
| 2012
|
£453m
|
|
|
|
£646m
|
|
|
|
NB. 2012 and 2013 Peripherals & Accessories figures include revenues for point cards
Game Culture
| Year
|
Toys & Merchandise
|
Books & Magazines
|
Movies & Soundtracks
|
Events & Venues
|
| Spend
|
% Growth
|
Spend
|
% Growth
|
Spend
|
% Growth
|
Spend
|
% Growth
|
| 2019
|
£94.2m
|
+48.0%
|
£13.9m
|
-21.6%
|
£29.5m
|
+24.9%
|
£8.8m
|
-0.8%
|
| 2018 (revised)
|
£63.6m
|
|
£17.8m
|
|
£23.6m
|
|
£8.9m
|
|
| 2018
|
£59.3m
|
-23.7%
|
£17.8m
|
-1.3%
|
£23.6m
|
+34.0%
|
£8.9m
|
+5.5%
|
| 2017
|
£72.9m
|
+6.8%
|
£18.0m
|
-2.3%
|
£17.6m
|
-29.9%
|
£8.4m
|
+13.4%
|
| 2016
|
£66.8m
|
+7.2%
|
£18.4m
|
+13.2%
|
£7.8m
|
+14.4%
|
£7.5m
|
+20.6%
|
| 2015
|
£62.3m
|
-9.7%
|
£16.3m
|
-29.1%
|
£6.9m
|
+26.9%
|
£6.2m
|
+12.7%
|
| 2014
|
£69m
|
+14.0%
|
£23m
|
+77.0%
|
£5.4m
|
-21.7%
|
£5.5m
|
+96.4%
|
| 2013
|
£80m
|
+3.8%
|
£13m
|
|
£6.9m
|
-4.0%
|
£2.8m
|
+16.0%
|
| 2012
|
£60m
|
|
|
|
£7.5m
|
|
£2.2m
|
|
